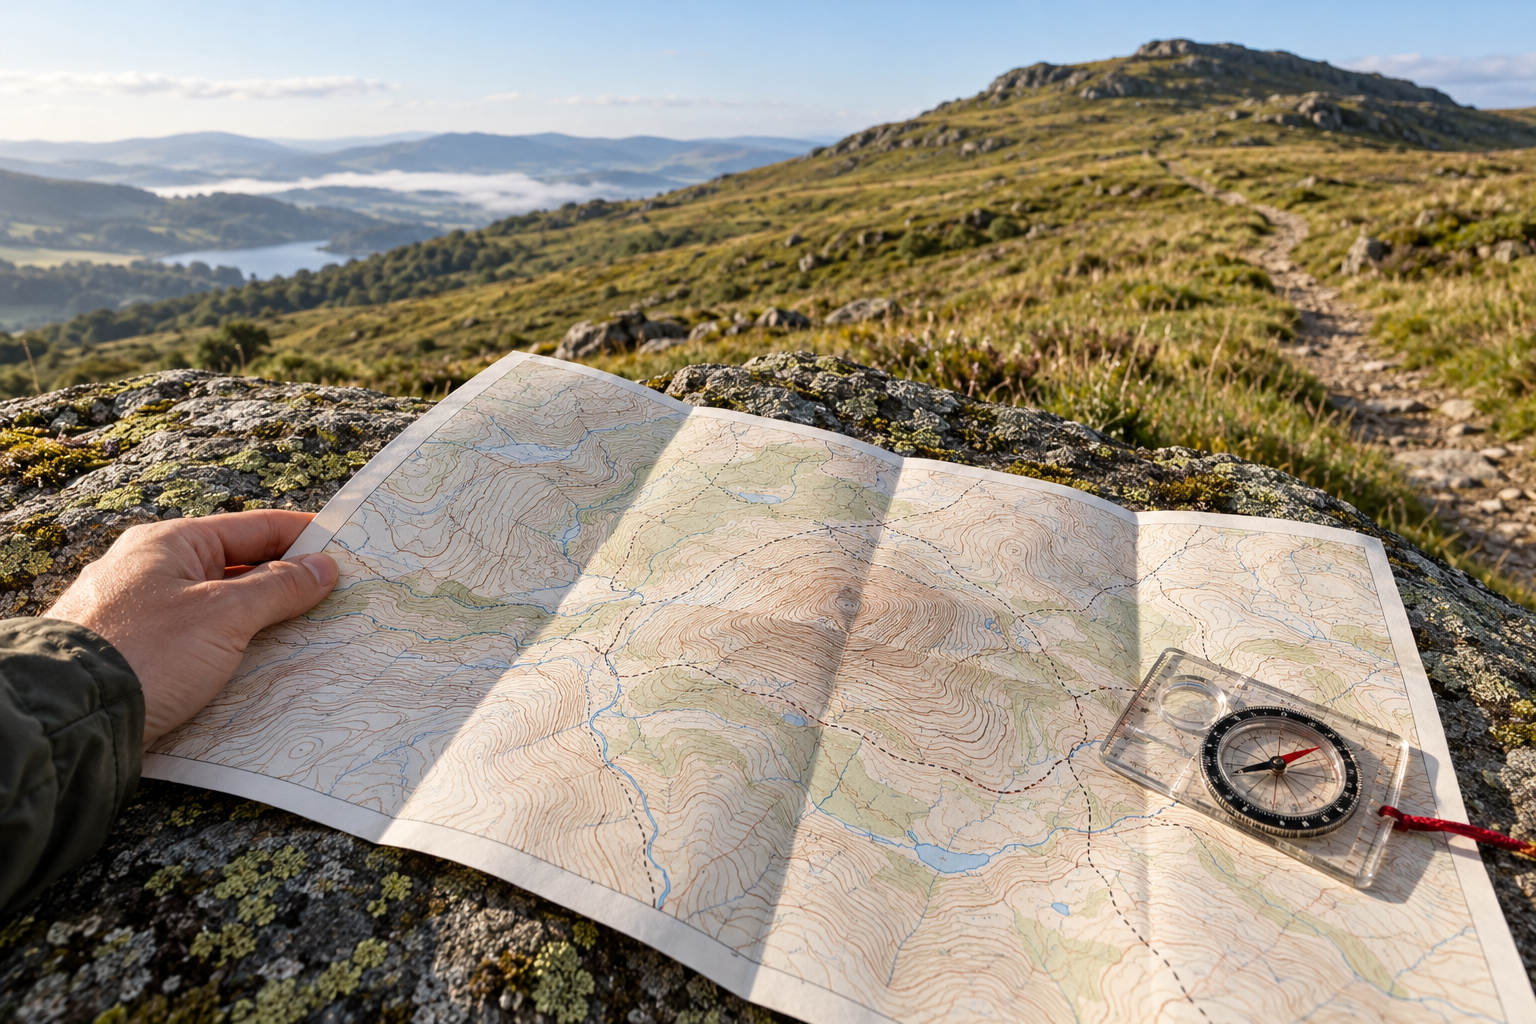
The path on the map looks harmless until it reaches a patch of crowded brown lines. They pinch together across the hillside, then open out near the top. That change is worth a pause before you set off. It may mark the part of the walk that takes the most effort, the part that asks for careful footing, or both. But the lines describe the land beneath the path. You still have to read the path itself.
A contour joins places of the same elevation. Step along one, in the map's simplified world, and you neither gain nor lose height. Cross to the next contour uphill and you have climbed one contour interval. On many Ordnance Survey 1:25,000 maps that interval is 5 metres; on many 1:50,000 maps it is 10 metres. The figure is printed on the map and needs checking rather than guessing from the lines' appearance. Ordnance Survey's relief guide illustrates the basic pattern: close contours mean a sharp slope, while wider gaps mean gentler ground.
The heavier lines help you keep count. On a USGS topographic map, these index contours carry elevation numbers, with thinner contours between them. The contour interval appears in the map margin; it varies with the terrain and the map. A fairly level area may have a small interval, while a mountainous map may use a much larger one so that its lines remain legible. The USGS map-symbol guide explains why line spacing alone is meaningful only within a map whose interval you know. Five crowded lines on one sheet may represent a different climb from five on another.
Put ground distance between the lines
The vertical step is only half the calculation. A steep slope climbs that step over a short horizontal distance. A gentle slope uses more ground to gain the same height. The map's scale supplies the distance. At 1:25,000, one centimetre on the paper represents 250 metres on the ground; one millimetre represents 25 metres. Ordnance Survey's account of scale also explains why a walking map shows a smaller area in more detail than a road map of a whole region.
Imagine an OS sheet with a 5-metre interval. Two neighboring contours are 2 millimetres apart, measured directly across the slope. Those 2 millimetres represent about 50 metres horizontally. A 5-metre rise over 50 metres is an average grade of about 10 percent for that strip of ground: one metre up for ten metres across. This is a worked example, not a measurement of a particular hill. If the interval were 10 metres, the same paper spacing at the same scale would imply twice the average grade. If you copied the shape to a map at a different scale, the distance would change again. First read the margin; then use the ruler.
The calculation becomes especially useful when the path is marked. If its line cuts repeatedly across contours in a short distance, expect substantial climbing or descending. If it runs roughly alongside a contour, it holds a more even elevation. A switchback can cross the same vertical band over a longer walking distance than a straight line up the slope, easing its average grade. The hillside can remain steep while the path climbs gently across it. Conversely, a long section with few crossings may feel straightforward before a final short burst through many lines. A route's total rise alone will not reveal that burst.
Trace the whole route rather than glancing at the tightest knot. Count the contours crossed on each leg, including descents that must be climbed again on the return. Read the elevation numbers to establish which side is uphill; a close set of lines does not, by itself, say whether you are ascending or descending. Look for a valley, ridge or saddle in the surrounding pattern and for streams and other mapped features that help you place the path in the landscape. The United States National Park Service describes topographic maps as tools for calculating distance, slope and position in off-road navigation. Those are three separate tasks, and a walker needs all three.
What the lines cannot promise
A contour map is a carefully made reduction of a complicated surface. At a given scale, small steps, gullies and broken ground may not fit. Ordnance Survey describes the cartographer's work of generalisation: some features are omitted, others simplified or moved slightly so that the map stays readable. Enlarging a small-scale map on a phone makes its symbols bigger; it does not restore the detail left out when the map was made. Its cartography guide is unusually direct about this necessary selection.
The limitation is older than digital mapping. A 1955 USGS account of topographic practice says that scale and contour interval determine how much relief can be shown. It describes smoothing small irregularities and, on some steep slopes, dropping intermediate contours for short distances to keep them from merging in print. That describes a historical mapping method, not a rule for every modern sheet. It is a sharp reminder that a patch with fewer visible lines need not be easy ground. Check the map's cliff, rock and scree symbols, and read the surrounding shape rather than treating a white gap as a wide grassy ramp.
Digital contours bring their own qualifications. USGS says its current contour layers come from elevation models with different source resolutions and are updated when significant landscape changes call for it. Its account of 3DEP contours describes those inputs and updates. An original USGS accuracy assessment found that elevation-data accuracy varied across its study area with the quality of the underlying sources. Neither finding means a useful walking map is unreliable as a whole. It means that the last small rise, eroded edge or altered trail cannot be guaranteed by a neat printed line.
Use the map to choose where you want to spend height and time. A more direct route across tightly packed contours may be worthwhile in good conditions and suitable terrain; a longer traverse may spread the climb. Traversing a steep hillside can still have awkward footing or exposure, so a gentler path grade is not a complete verdict on difficulty. Check current route information and conditions, then compare the map with what you can actually see underfoot. If the ground does not match the picture you expected, stop at a secure place and reorient before committing to the next section.
The crowded brown lines have done their job when they make you ask a better question than “Is it steep?” They show how much height the land gains in how little horizontal space. Scale tells you the size of that space. The route line shows how you may pass through it. The walk itself supplies the final detail.

A thought worth keeping?